* grafana/dashboards/nginx.json: re-add exported_namespace as a variable (was deleted entirely in #9523) * dashboards/nginx.json: switch around ingress and namespace selectors, and rename "Exported Namespace" to "Ingress Namespace" authored by tghartland at https://gist.github.com/tghartland/9147d88f991a95d4bab0fa7278c237eb * dashboards/nginx.json: make "Ingress Request Volume" and "Ingress Success Rate" panels look at selected Ingress Namespaces only, and rename two panel titels to use the renamed variable as suggested by tghartland in https://github.com/kubernetes/ingress-nginx/pull/9092#issuecomment-1285840900 * dashboards/nginx.json: apply Ingress Namespace selection to "Ingress Percentile Response Times and Transfer Rates" as well this is from https://github.com/kubernetes/ingress-nginx/pull/9092#issuecomment-1287114743 also by tghartland |
||
|---|---|---|
| .. | ||
| .markdownlint.json | ||
| nginx.json | ||
| README.md | ||
| request-handling-performance.json | ||
| request-handling.png | ||
| screenshot.png | ||
Grafana Dashboards
Ingress-nginx supports a rich collection of prometheus metrics. If you have prometheus and grafana installed on your cluster then prometheus will already be scraping this data due to the scrape annotation on the deployment.
This folder contains two dashboards that you can import.
1. Ingress-Nginx Controller
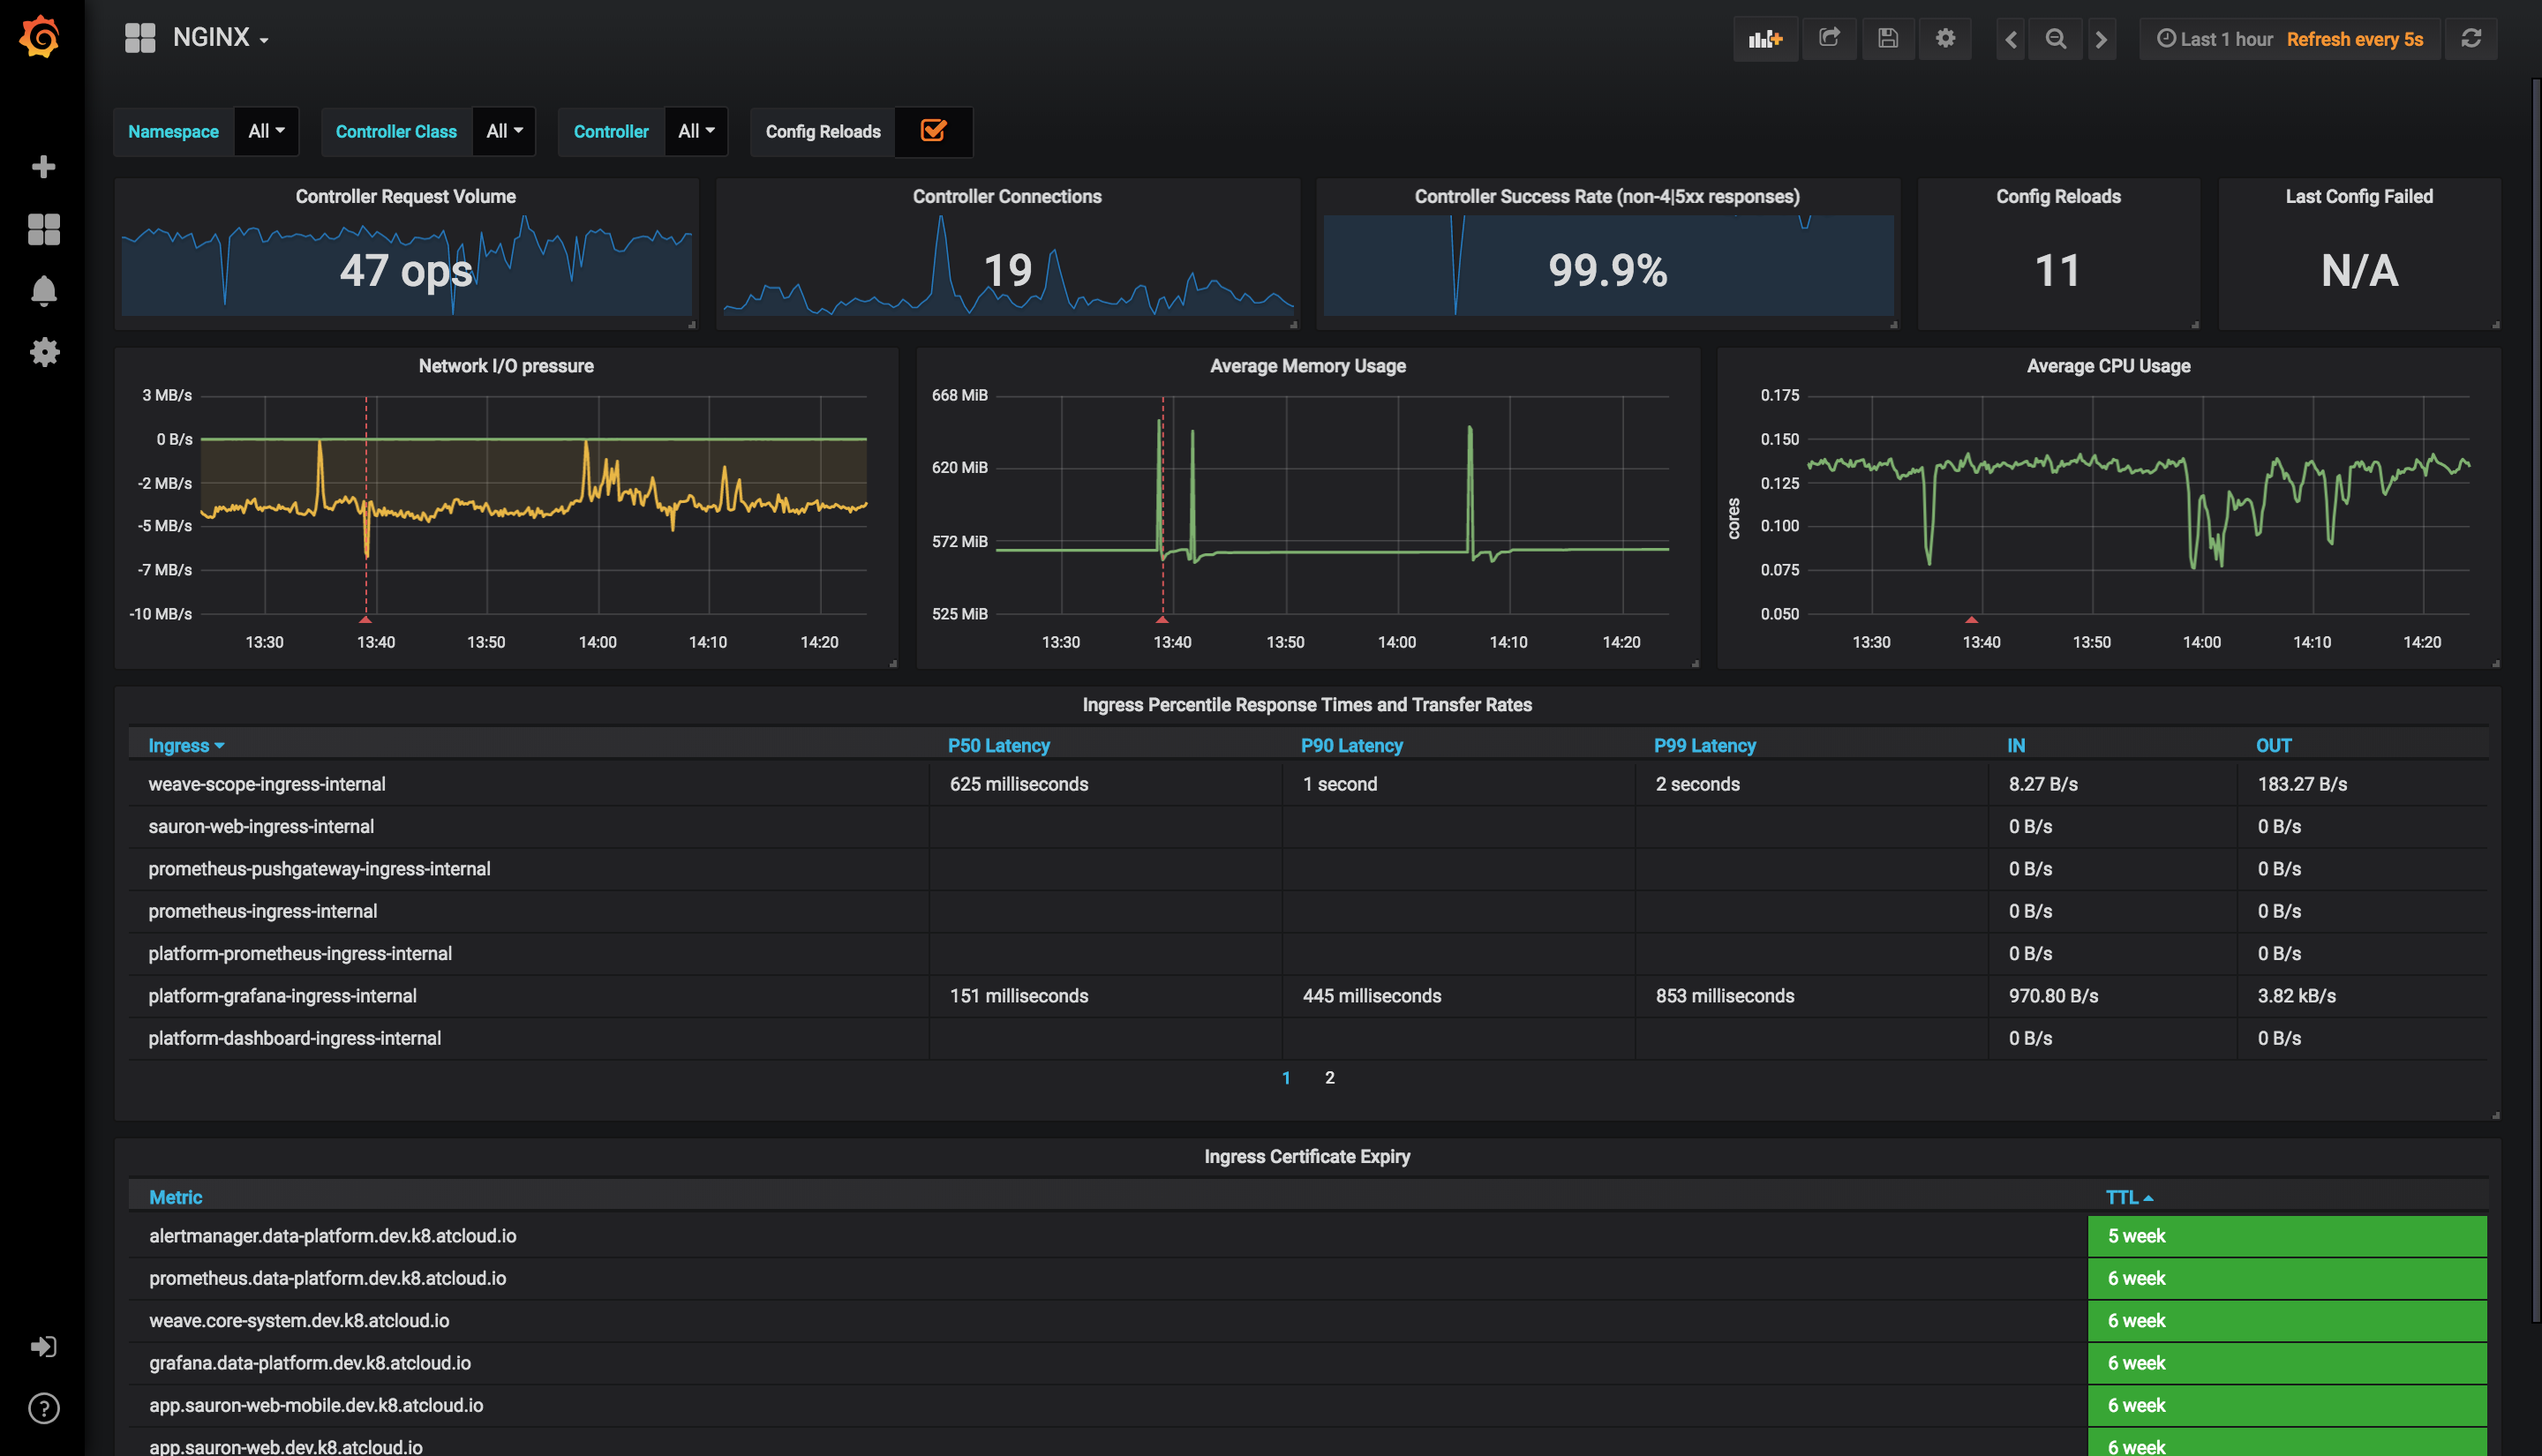
Features
- Ability to filter by Namespace, Controller Class and Controller
- Visibility of Request Volume, connections, success rates, config reloads and configs out of sync.
- Network IO pressure, memory and CPU use
- Ingress P50, P95 and P99 percentile response times with IN/OUT throughput
- SSL certificate expiry
- Annotational overlays to show when config reloads happened
Requirements
- Grafana v5.2.0 (or newer)
2. Request Handling Performance
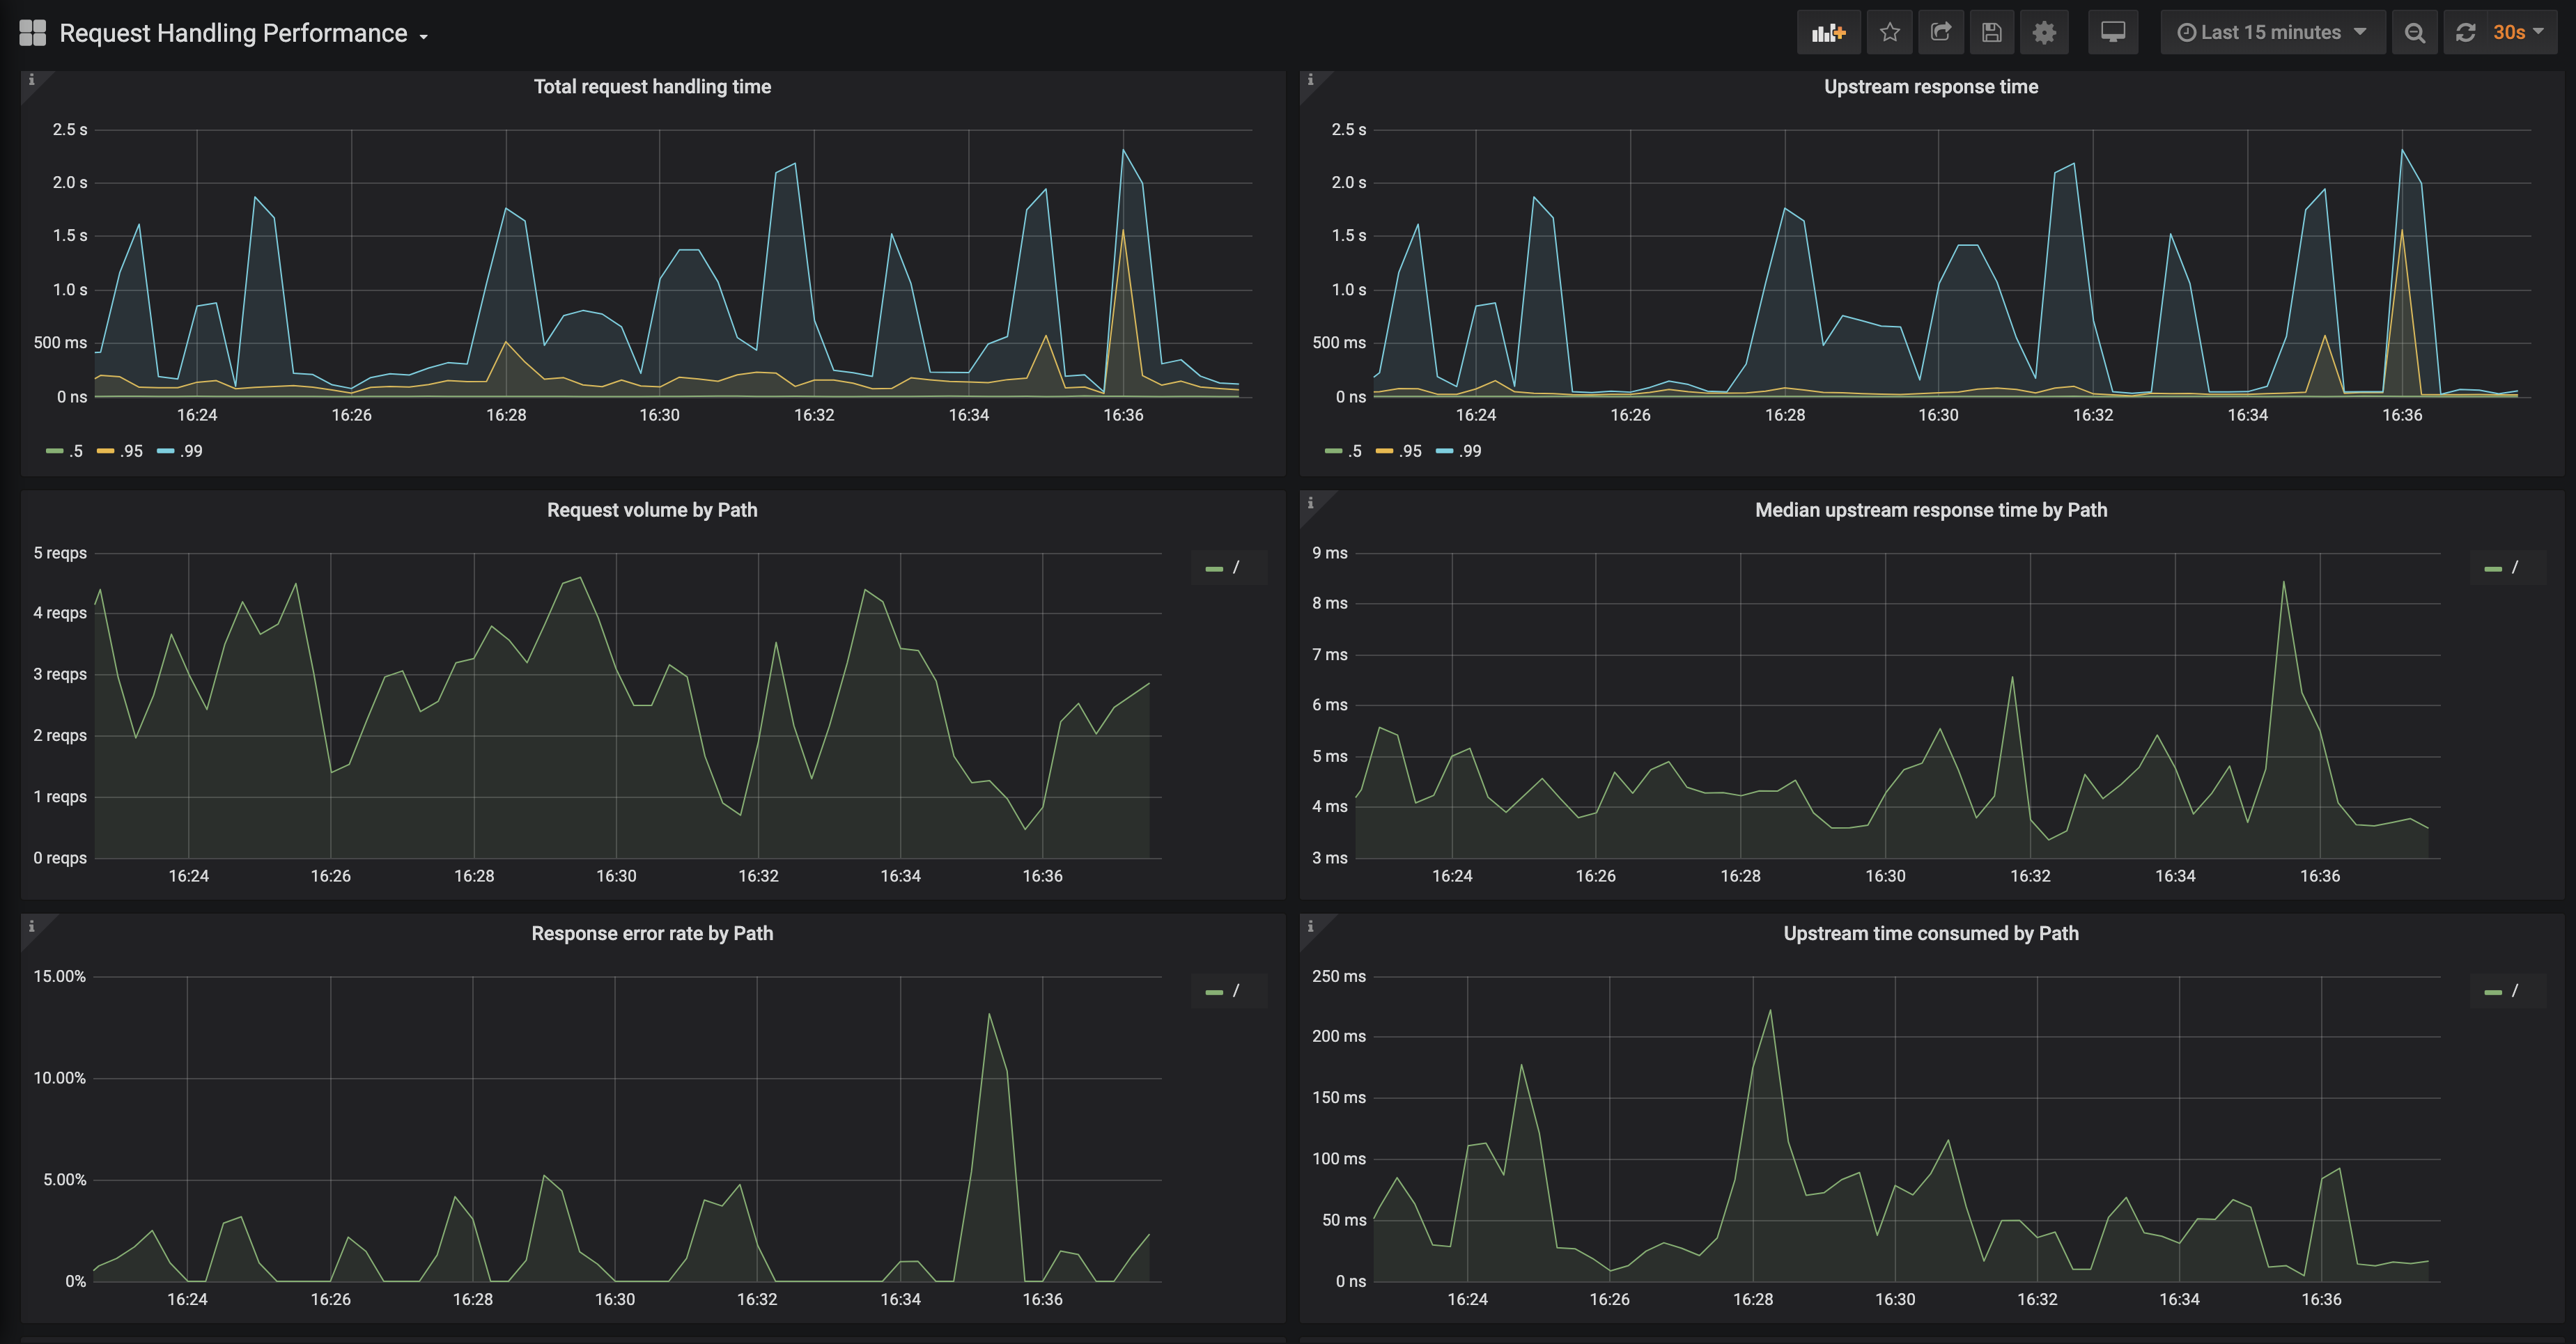
Features
- Ability to filter by Ingress
- P50, P95 and P99 percentile of total request and upstream response times
- Request volume by path
- Error volume and error rate by path
- Average response time by path
- ...and more
Requirements
- Grafana v6.6.0 (or newer)