1.6 KiB
1.6 KiB
Victoria k8s Stack
We use Victoria Metrics k8s stack and Vector.
Why do we use it?
-
compare it with competitors like ELK, Loki, Prometheus
-
it delivers logging and metrics
-
in ELK we replaced the 'E'(ElasticSearch) by VictoriaLogs and VictoriaMetrics, L(Logstash) is replaced by Vector, 'K'(Kibana) by Grafana
-
Loki (also the 'E'): has 5 components (like distrubutor, querier, querier-frontend....), VM
-
ELK is hard to manage
-
Durability: We need to store logs for years, there should be a 'shrink' process
-
Challenge: Scaling, there are huge amounts of data (like TB/d)
-
we urde for simplicity, cost, scalability
Big Picture
Architecture
The high level deployment picture of VictoriaMetrics k8 s Stack looks like this:
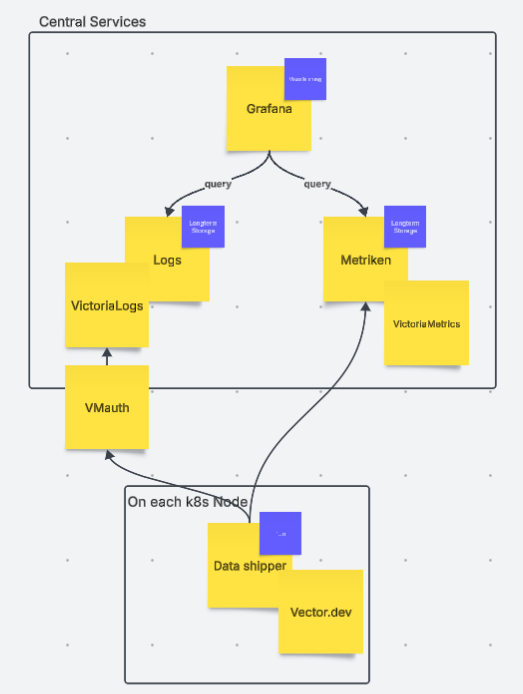
Deployment
In detail, after having deployed it, we see the following components:
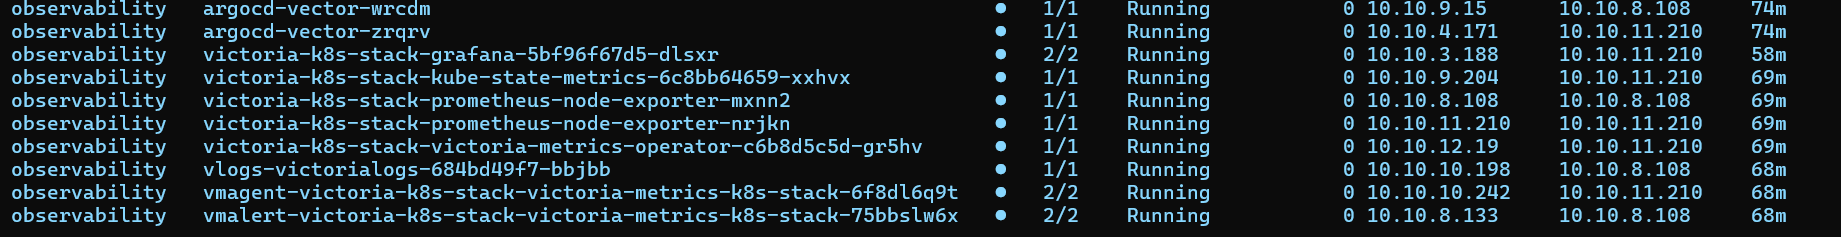
- vector-vector: the log shipper to victorialogs, twice because it is a daemon-set and thus deploed on each node in the cluster
- prometheus-node-exporter: a metrics generator and metrics endpoint of node metrics, also deployed on each node
- vmagent: the central agent scraping data from the metrics collectors
- vmalert: not used yet
- vmsingle-victoria-metrics: the metrics server, getting the data from vmagent
- vlogs: the logging server, getting the data from vector
- victoria-metrics-operator: the operator providing and managing the custom resources we deploy