* clarify link * Add section headers * console blocks * grpc example json was not valid * multi-tls update text The preceding point 1 related to4f2cb51ef8/ingress/controllers/nginx/examples/ingress.yamland the deployments referenced in4f2cb51ef8/ingress/controllers/nginx/examples/README.mdThey are not relevant to the current instructions. * add whitespace around parens * grammar setup would be a proper noun, but it is not the intended concept, which is a state * grammar * is-only * via * Use bullets for choices * ingress-controller nginx is a distinct brand. generally this repo talks about ingress-controller, although it is quite inconsistent about how... * drop stray paren * OAuth is a brand and needs an article here also GitHub is a brand * Indent text under numbered lists * use e.g. * Document that customer header config maps changes do not trigger updates This should be removed if https://github.com/kubernetes/ingress-nginx/issues/5238 is fixed. * article * period * infinitive verb + period * clarify that the gRPC server is responsible for listening for TCP traffic and not some other part of the backend application * avoid using ; and reword * whitespace * brand: gRPC * only-does is the right form `for` adds nothing here * spelling: GitHub * punctuation `;` is generally not the right punctuation... * drop stray `to` * sentence * backticks * fix link * Improve readability of compare/vs * Renumber list * punctuation * Favor Ingress-NGINX and Ingress NGINX * Simplify custom header restart text * Undo typo damage Co-authored-by: Josh Soref <jsoref@users.noreply.github.com>
7.3 KiB
Prometheus and Grafana installation
This tutorial will show you how to install Prometheus and Grafana for scraping the metrics of the NGINX Ingress controller.
!!! important
This example uses emptyDir volumes for Prometheus and Grafana. This means once the pod gets terminated you will lose all the data.
Before You Begin
-
The NGINX Ingress controller should already be deployed according to the deployment instructions here.
-
The controller should be configured for exporting metrics. This requires 3 configurations to the controller. These configurations are :
- controller.metrics.enabled=true
- controller.podAnnotations."prometheus.io/scrape"="true"
- controller.podAnnotations."prometheus.io/port"="10254"
- The easiest way to configure the controller for metrics is via helm upgrade. Assuming you have installed the ingress-nginx controller as a helm release named ingress-controller, then you can simply type the command show below :
helm upgrade ingress-controller ingress-nginx/ingress-nginx \ --namespace ingress-nginx \ --set controller.metrics.enabled=true \ --set-string controller.podAnnotations."prometheus\.io/scrape"="true" \ --set-string controller.podAnnotations."prometheus\.io/port"="10254"- You can validate that the controller is configured for metrics by looking at the values of the installed release, like this:
helm get values ingress-controller --namespace ingress-nginx- You should be able to see the values shown below:
.. controller: metrics: enabled: true service: annotations: prometheus.io/port: "10254" prometheus.io/scrape: "true" ..- If you are not using helm, you will have to edit your manifests like this:
-
Service manifest:
apiVersion: v1 kind: Service metadata: annotations: prometheus.io/scrape: "true" prometheus.io/port: "10254" .. spec: ports: - name: prometheus port: 10254 targetPort: prometheus .. -
DaemonSet manifest:
..
ports:
  - name: prometheus
    containerPort: 10254
  ..
-
Deploy and configure Prometheus Server
Note that the kustomize bases used in this tutorial are stored in the deploy folder of the GitHub repository kubernetes/ingress-nginx.
-
The Prometheus server must be configured so that it can discover endpoints of services. If a Prometheus server is already running in the cluster and if it is configured in a way that it can find the ingress controller pods, no extra configuration is needed.
-
If there is no existing Prometheus server running, the rest of this tutorial will guide you through the steps needed to deploy a properly configured Prometheus server.
-
Running the following command deploys prometheus in Kubernetes:
kubectl apply --kustomize github.com/kubernetes/ingress-nginx/deploy/prometheus/
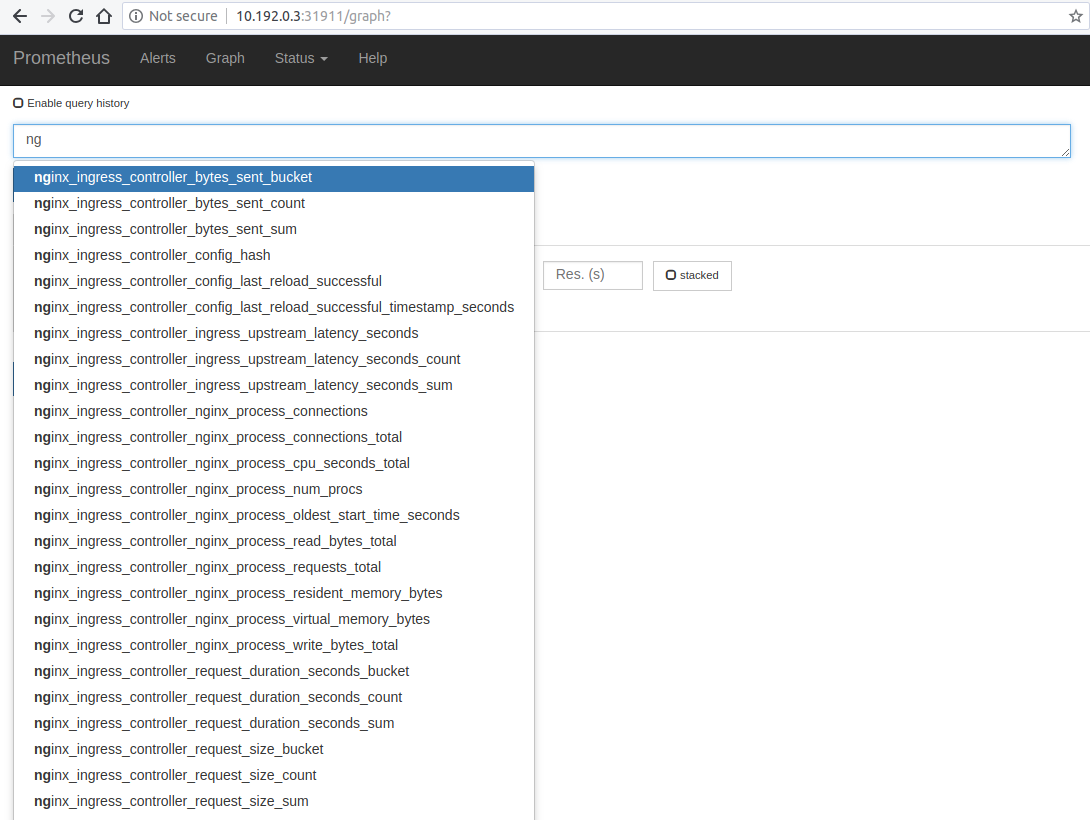
Prometheus Dashboard
-
Open Prometheus dashboard in a web browser:
kubectl get svc -n ingress-nginx NAME TYPE CLUSTER-IP EXTERNAL-IP PORT(S) AGE default-http-backend ClusterIP 10.103.59.201 <none> 80/TCP 3d ingress-nginx NodePort 10.97.44.72 <none> 80:30100/TCP,443:30154/TCP,10254:32049/TCP 5h prometheus-server NodePort 10.98.233.86 <none> 9090:32630/TCP 1m- Obtain the IP address of the nodes in the running cluster:
kubectl get nodes -o wide- In some cases where the node only have internal IP addresses we need to execute:
kubectl get nodes --selector=kubernetes.io/role!=master -o jsonpath={.items[*].status.addresses[?\(@.type==\"InternalIP\"\)].address} 10.192.0.2 10.192.0.3 10.192.0.4-
Open your browser and visit the following URL: http://{node IP address}:{prometheus-svc-nodeport} to load the Prometheus Dashboard.
-
According to the above example, this URL will be http://10.192.0.3:32630
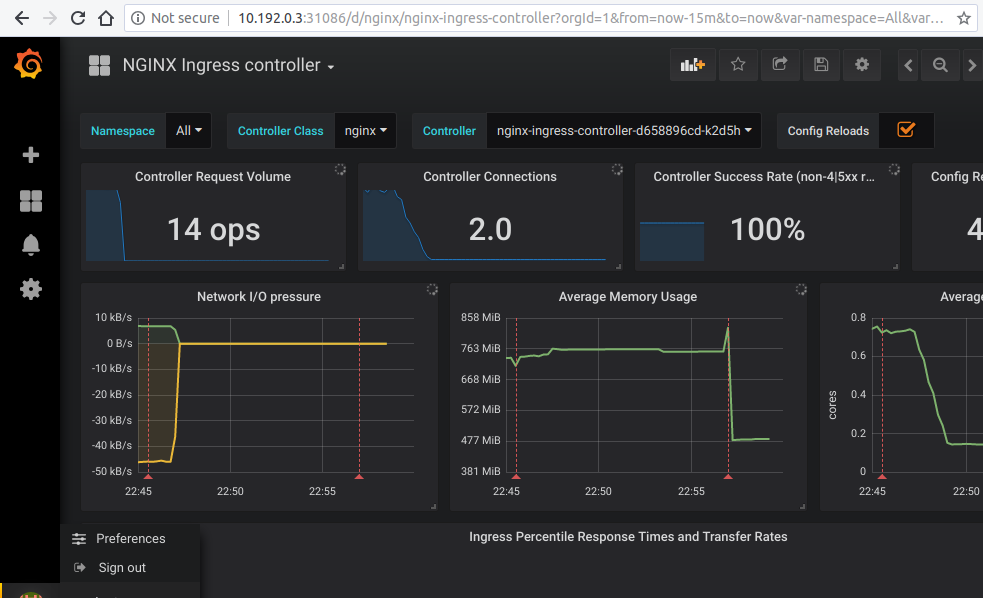
Grafana
- Install grafana using the below command
kubectl apply --kustomize github.com/kubernetes/ingress-nginx/deploy/grafana/
- Look at the services
kubectl get svc -n ingress-nginx
NAME                   TYPE        CLUSTER-IP      EXTERNAL-IP   PORT(S)                                      AGE
default-http-backend   ClusterIP   10.103.59.201   <none>        80/TCP                                       3d
ingress-nginx          NodePort    10.97.44.72     <none>        80:30100/TCP,443:30154/TCP,10254:32049/TCP   5h
prometheus-server      NodePort    10.98.233.86    <none>        9090:32630/TCP                               10m
grafana                NodePort    10.98.233.87    <none>        3000:31086/TCP                               10m
- Open your browser and visit the following URL: http://{node IP address}:{grafana-svc-nodeport} to load the Grafana Dashboard. According to the above example, this URL will be http://10.192.0.3:31086
The username and password is admin
-
After the login you can import the Grafana dashboard from official dashboards, by following steps given below :
- Navigate to lefthand panel of grafana
- Hover on the gearwheel icon for Configuration and click "Data Sources"
- Click "Add data source"
- Select "Prometheus"
- Enter the details (note: I used http://CLUSTER_IP_PROMETHEUS_SVC:9090)
- Left menu (hover over +) -> Dashboard
- Click "Import"
- Enter the copy pasted json from https://raw.githubusercontent.com/kubernetes/ingress-nginx/main/deploy/grafana/dashboards/nginx.json
- Click Import JSON
- Select the Prometheus data source
- Click "Import"
Caveats
Wildcard ingresses
- By default request metrics are labeled with the hostname. When you have a wildcard domain ingress, then there will be no metrics for that ingress (to prevent the metrics from exploding in cardinality). To get metrics in this case you need to run the ingress controller with
--metrics-per-host=false(you will lose labeling by hostname, but still have labeling by ingress).
Grafana dashboard using ingress resource
- If you want to expose the dashboard for grafana using a ingress resource, then you can :
- change the service type of the prometheus-server service and the grafana service to "ClusterIP" like this :
kubectl -n ingress-nginx edit svc grafana- This will open the currently deployed service grafana in the default editor configured in your shell (vi/nvim/nano/other)
- scroll down to line 34 that looks like "type: NodePort"
- change it to look like "type: ClusterIP". Save and exit.
- create a ingress resource with backend as "grafana" and port as "3000"
- Similarly, you can edit the service "prometheus-server" and add a ingress resource.