4.2 KiB
Prometheus and Grafana installation
This tutorial will show you how to install Prometheus and Grafana for scraping the metrics of the NGINX Ingress controller.
!!! important
This example uses emptyDir volumes for Prometheus and Grafana. This means once the pod gets terminated you will lose all the data.
Before You Begin
The NGINX Ingress controller should already be deployed according to the deployment instructions here.
Note that the yaml files used in this tutorial are stored in the deploy/monitoring folder of the GitHub repository kubernetes/ingress-nginx.
Deploy and configure Prometheus Server
The Prometheus server must be configured so that it can discover endpoints of services. If a Prometheus server is already running in the cluster and if it is configured in a way that it can find the ingress controller pods, no extra configuration is needed.
If there is no existing Prometheus server running, the rest of this tutorial will guide you through the steps needed to deploy a properly configured Prometheus server.
Running the following command deploys the prometheus configuration in Kubernetes:
kubectl create -f https://raw.githubusercontent.com/kubernetes/ingress-nginx/master/deploy/monitoring/configuration.yaml
configmap "prometheus-configuration" created
Running the following command deploys prometheus in Kubernetes:
kubectl create -f https://raw.githubusercontent.com/kubernetes/ingress-nginx/master/deploy/monitoring/prometheus.yaml
clusterrole "prometheus-server" created
serviceaccount "prometheus-server" created
clusterrolebinding "prometheus-server" created
deployment "prometheus-server" created
service "prometheus-service" created
Prometheus Dashboard
Open Prometheus dashboard in a web browser:
kubectl get svc -n ingress-nginx
NAME                   TYPE        CLUSTER-IP      EXTERNAL-IP   PORT(S)                                      AGE
default-http-backend   ClusterIP   10.103.59.201   <none>        80/TCP                                       3d
ingress-nginx          NodePort    10.97.44.72     <none>        80:30100/TCP,443:30154/TCP,10254:32049/TCP   5h
prometheus             NodePort    10.98.233.86    <none>        9090:32630/TCP                               1m
Obtain the IP address of the nodes in the running cluster:
kubectl get nodes -o wide
In some cases where the node only have internal IP adresses we need to execute:
kubectl get nodes --selector=kubernetes.io/role!=master -o jsonpath={.items[*].status.addresses[?\(@.type==\"InternalIP\"\)].address}
10.192.0.2 10.192.0.3 10.192.0.4
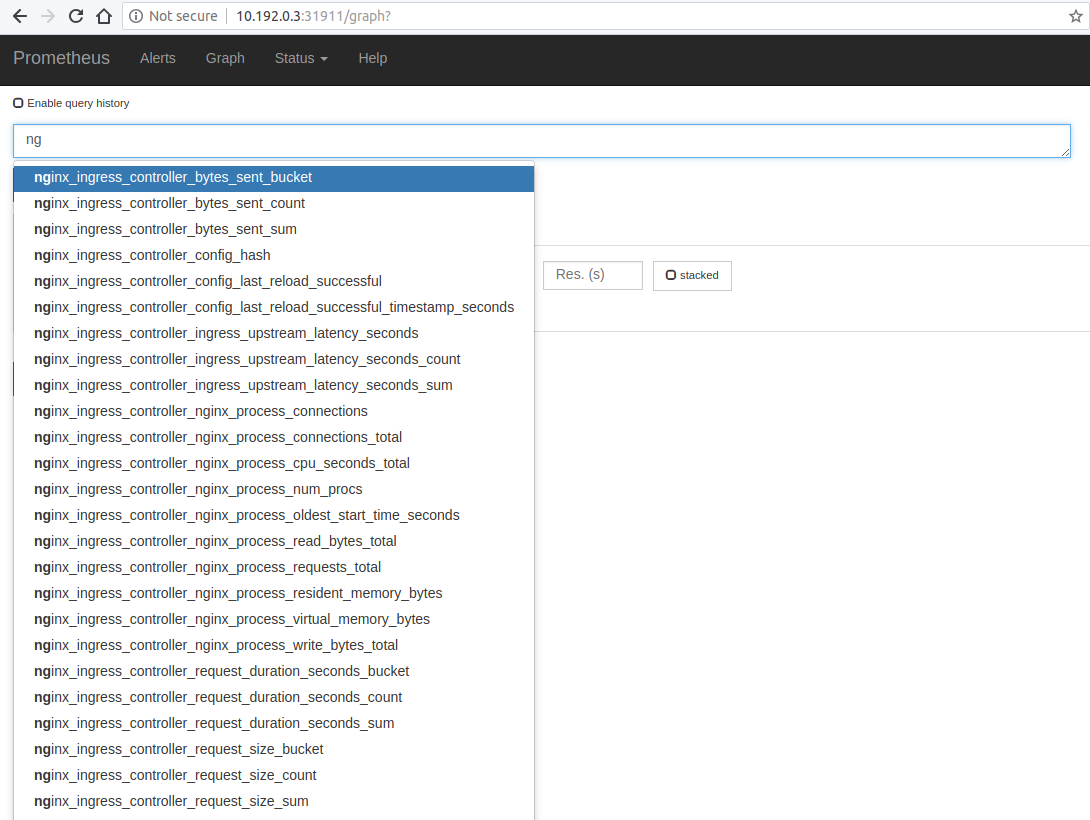
Open your browser and visit the following URL: http://{node IP address}:{prometheus-svc-nodeport} to load the Prometheus Dashboard.
According to the above example, this URL will be http://10.192.0.3:32630
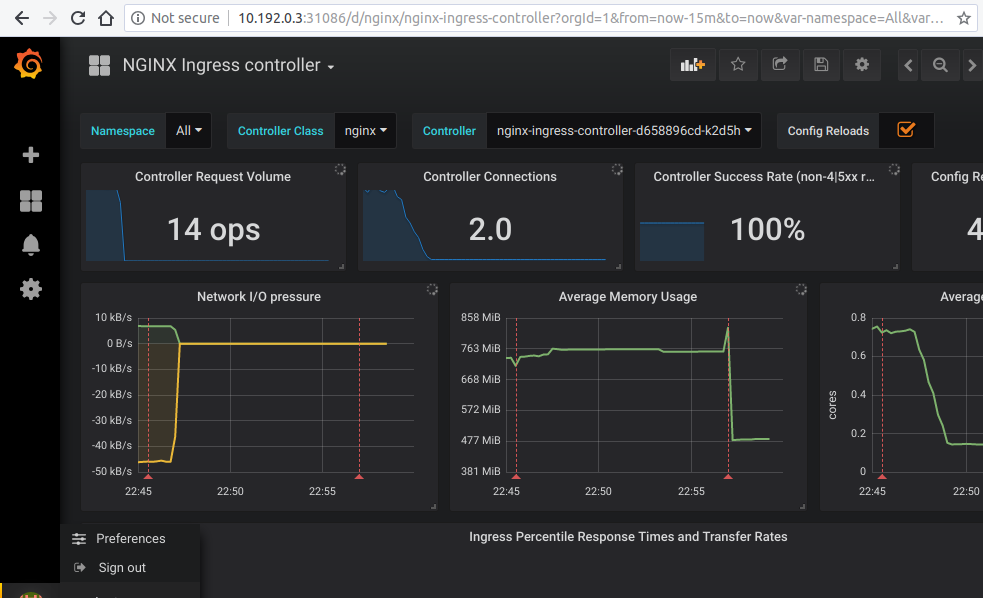
Grafana
kubectl create -f https://raw.githubusercontent.com/kubernetes/ingress-nginx/master/deploy/monitoring/grafana.yaml
kubectl get svc -n ingress-nginx
NAME                   TYPE        CLUSTER-IP      EXTERNAL-IP   PORT(S)                                      AGE
default-http-backend   ClusterIP   10.103.59.201   <none>        80/TCP                                       3d
ingress-nginx          NodePort    10.97.44.72     <none>        80:30100/TCP,443:30154/TCP,10254:32049/TCP   5h
prometheus             NodePort    10.98.233.86    <none>        9090:32630/TCP                               10m
grafana                NodePort    10.98.233.86    <none>        9090:31086/TCP                               10m
Open your browser and visit the following URL: http://{node IP address}:{grafana-svc-nodeport} to load the Grafana Dashboard. According to the above example, this URL will be http://10.192.0.3:31086
The username and password is admin
After the login you can import the Grafana dashboard from https://github.com/kubernetes/ingress-nginx/tree/master/deploy/grafana/dashboards