17 KiB
Prometheus and Grafana installation
Two different methods to install and configure Prometheus and Grafana are described in this doc.
- Prometheus and Grafana installation using Pod Annotations. This installs Prometheus and Grafana in the same namespace as NGINX Ingress
- Prometheus and Grafana installation using Service Monitors. This installs Prometheus and Grafana in two different namespaces. This is the preferred method, and helm charts supports this by default.
PROMETHEUS AND GRAFANA INSTALLATION USING POD ANNOTATIONS
This tutorial will show you how to install Prometheus and Grafana for scraping the metrics of the NGINX Ingress controller.
!!! important
This example uses emptyDir volumes for Prometheus and Grafana. This means once the pod gets terminated you will lose all the data.
Before You Begin
-
The NGINX Ingress controller should already be deployed according to the deployment instructions here.
-
The controller should be configured for exporting metrics. This requires 3 configurations to the controller. These configurations are :
- controller.metrics.enabled=true
- controller.podAnnotations."prometheus.io/scrape"="true"
- controller.podAnnotations."prometheus.io/port"="10254"
- The easiest way to configure the controller for metrics is via helm upgrade. Assuming you have installed the ingress-nginx controller as a helm release named ingress-controller, then you can simply type the command show below :
helm upgrade ingress-nginx ingress-nginx \ --repo https://kubernetes.github.io/ingress-nginx \ --namespace ingress-nginx \ --set controller.metrics.enabled=true \ --set-string controller.podAnnotations."prometheus\.io/scrape"="true" \ --set-string controller.podAnnotations."prometheus\.io/port"="10254"- You can validate that the controller is configured for metrics by looking at the values of the installed release, like this:
helm get values ingress-controller --namespace ingress-nginx- You should be able to see the values shown below:
.. controller: metrics: enabled: true service: annotations: prometheus.io/port: "10254" prometheus.io/scrape: "true" ..- If you are not using helm, you will have to edit your manifests like this:
- Service manifest:
apiVersion: v1 kind: Service metadata: annotations: prometheus.io/scrape: "true" prometheus.io/port: "10254" .. spec: ports: - name: prometheus port: 10254 targetPort: prometheus .. - Deployment manifest:
apiVersion: v1
kind: Deployment
metadata:
 annotations:
   prometheus.io/scrape: "true"
   prometheus.io/port: "10254"
..
spec:
  ports:
    - name: prometheus
      containerPort: 10254
      ..
- Service manifest:
Deploy and configure Prometheus Server
Note that the kustomize bases used in this tutorial are stored in the deploy folder of the GitHub repository kubernetes/ingress-nginx.
-
The Prometheus server must be configured so that it can discover endpoints of services. If a Prometheus server is already running in the cluster and if it is configured in a way that it can find the ingress controller pods, no extra configuration is needed.
-
If there is no existing Prometheus server running, the rest of this tutorial will guide you through the steps needed to deploy a properly configured Prometheus server.
-
Running the following command deploys prometheus in Kubernetes:
kubectl apply --kustomize github.com/kubernetes/ingress-nginx/deploy/prometheus/
Prometheus Dashboard
-
Open Prometheus dashboard in a web browser:
kubectl get svc -n ingress-nginx NAME TYPE CLUSTER-IP EXTERNAL-IP PORT(S) AGE default-http-backend ClusterIP 10.103.59.201 <none> 80/TCP 3d ingress-nginx NodePort 10.97.44.72 <none> 80:30100/TCP,443:30154/TCP,10254:32049/TCP 5h prometheus-server NodePort 10.98.233.86 <none> 9090:32630/TCP 1m- Obtain the IP address of the nodes in the running cluster:
kubectl get nodes -o wide- In some cases where the node only have internal IP addresses we need to execute:
kubectl get nodes --selector=kubernetes.io/role!=master -o jsonpath={.items[*].status.addresses[?\(@.type==\"InternalIP\"\)].address} 10.192.0.2 10.192.0.3 10.192.0.4-
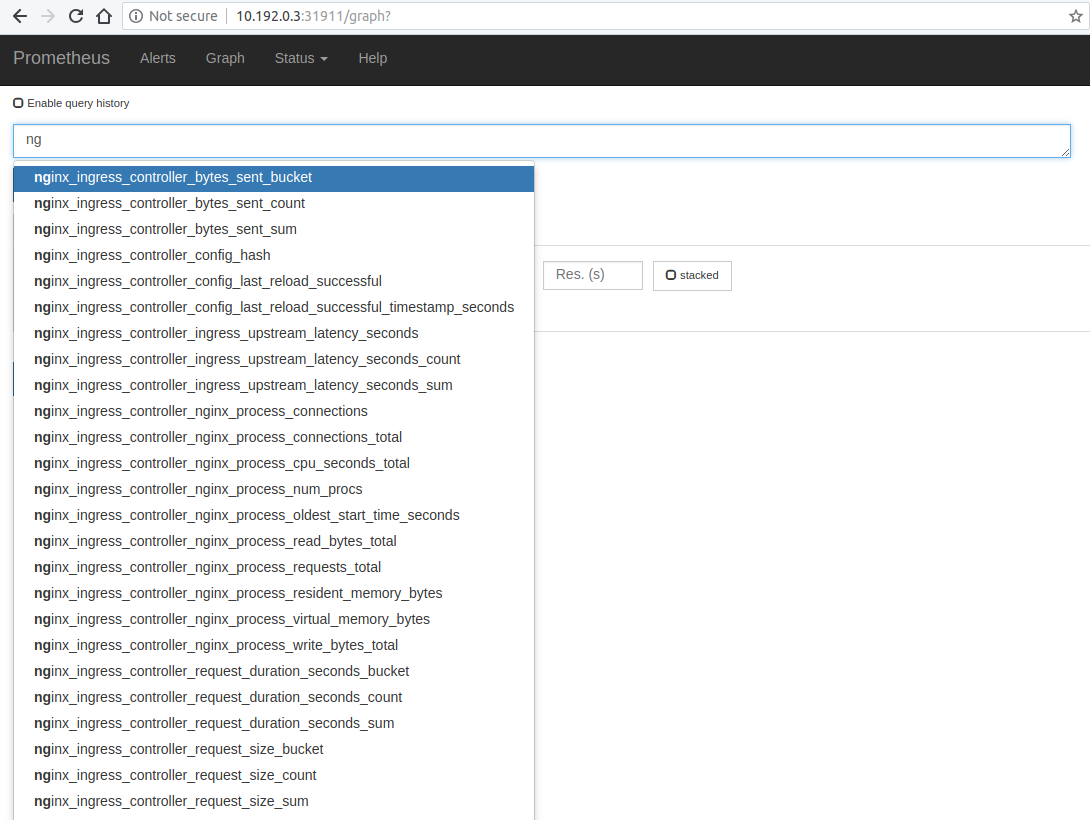
Open your browser and visit the following URL: http://{node IP address}:{prometheus-svc-nodeport} to load the Prometheus Dashboard.
-
According to the above example, this URL will be http://10.192.0.3:32630
Grafana
- Install grafana using the below command
kubectl apply --kustomize github.com/kubernetes/ingress-nginx/deploy/grafana/
- Look at the services
kubectl get svc -n ingress-nginx
NAME                   TYPE        CLUSTER-IP      EXTERNAL-IP   PORT(S)                                      AGE
default-http-backend   ClusterIP   10.103.59.201   <none>        80/TCP                                       3d
ingress-nginx          NodePort    10.97.44.72     <none>        80:30100/TCP,443:30154/TCP,10254:32049/TCP   5h
prometheus-server      NodePort    10.98.233.86    <none>        9090:32630/TCP                               10m
grafana                NodePort    10.98.233.87    <none>        3000:31086/TCP                               10m
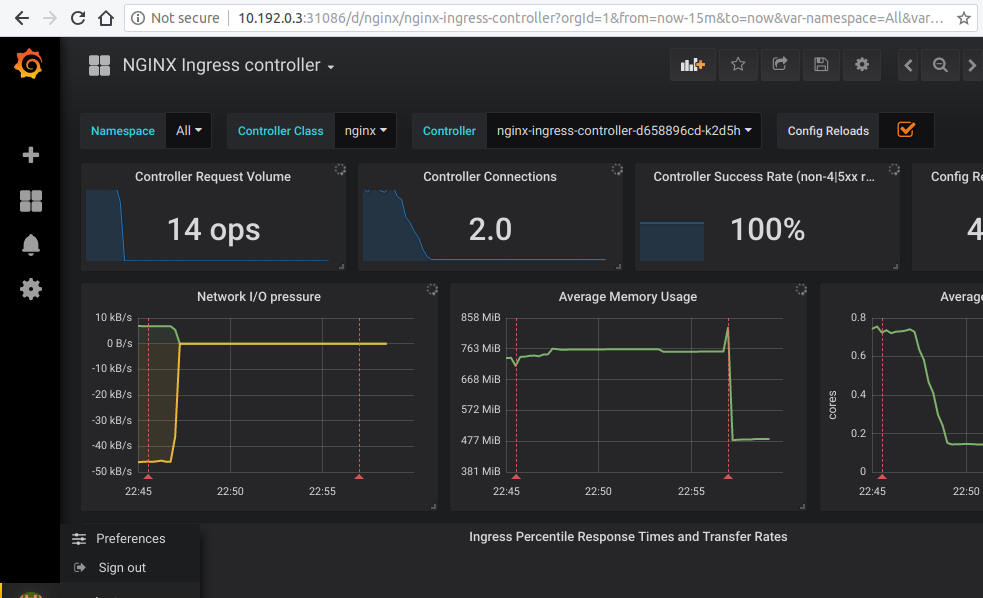
- Open your browser and visit the following URL: http://{node IP address}:{grafana-svc-nodeport} to load the Grafana Dashboard. According to the above example, this URL will be http://10.192.0.3:31086
The username and password is admin
-
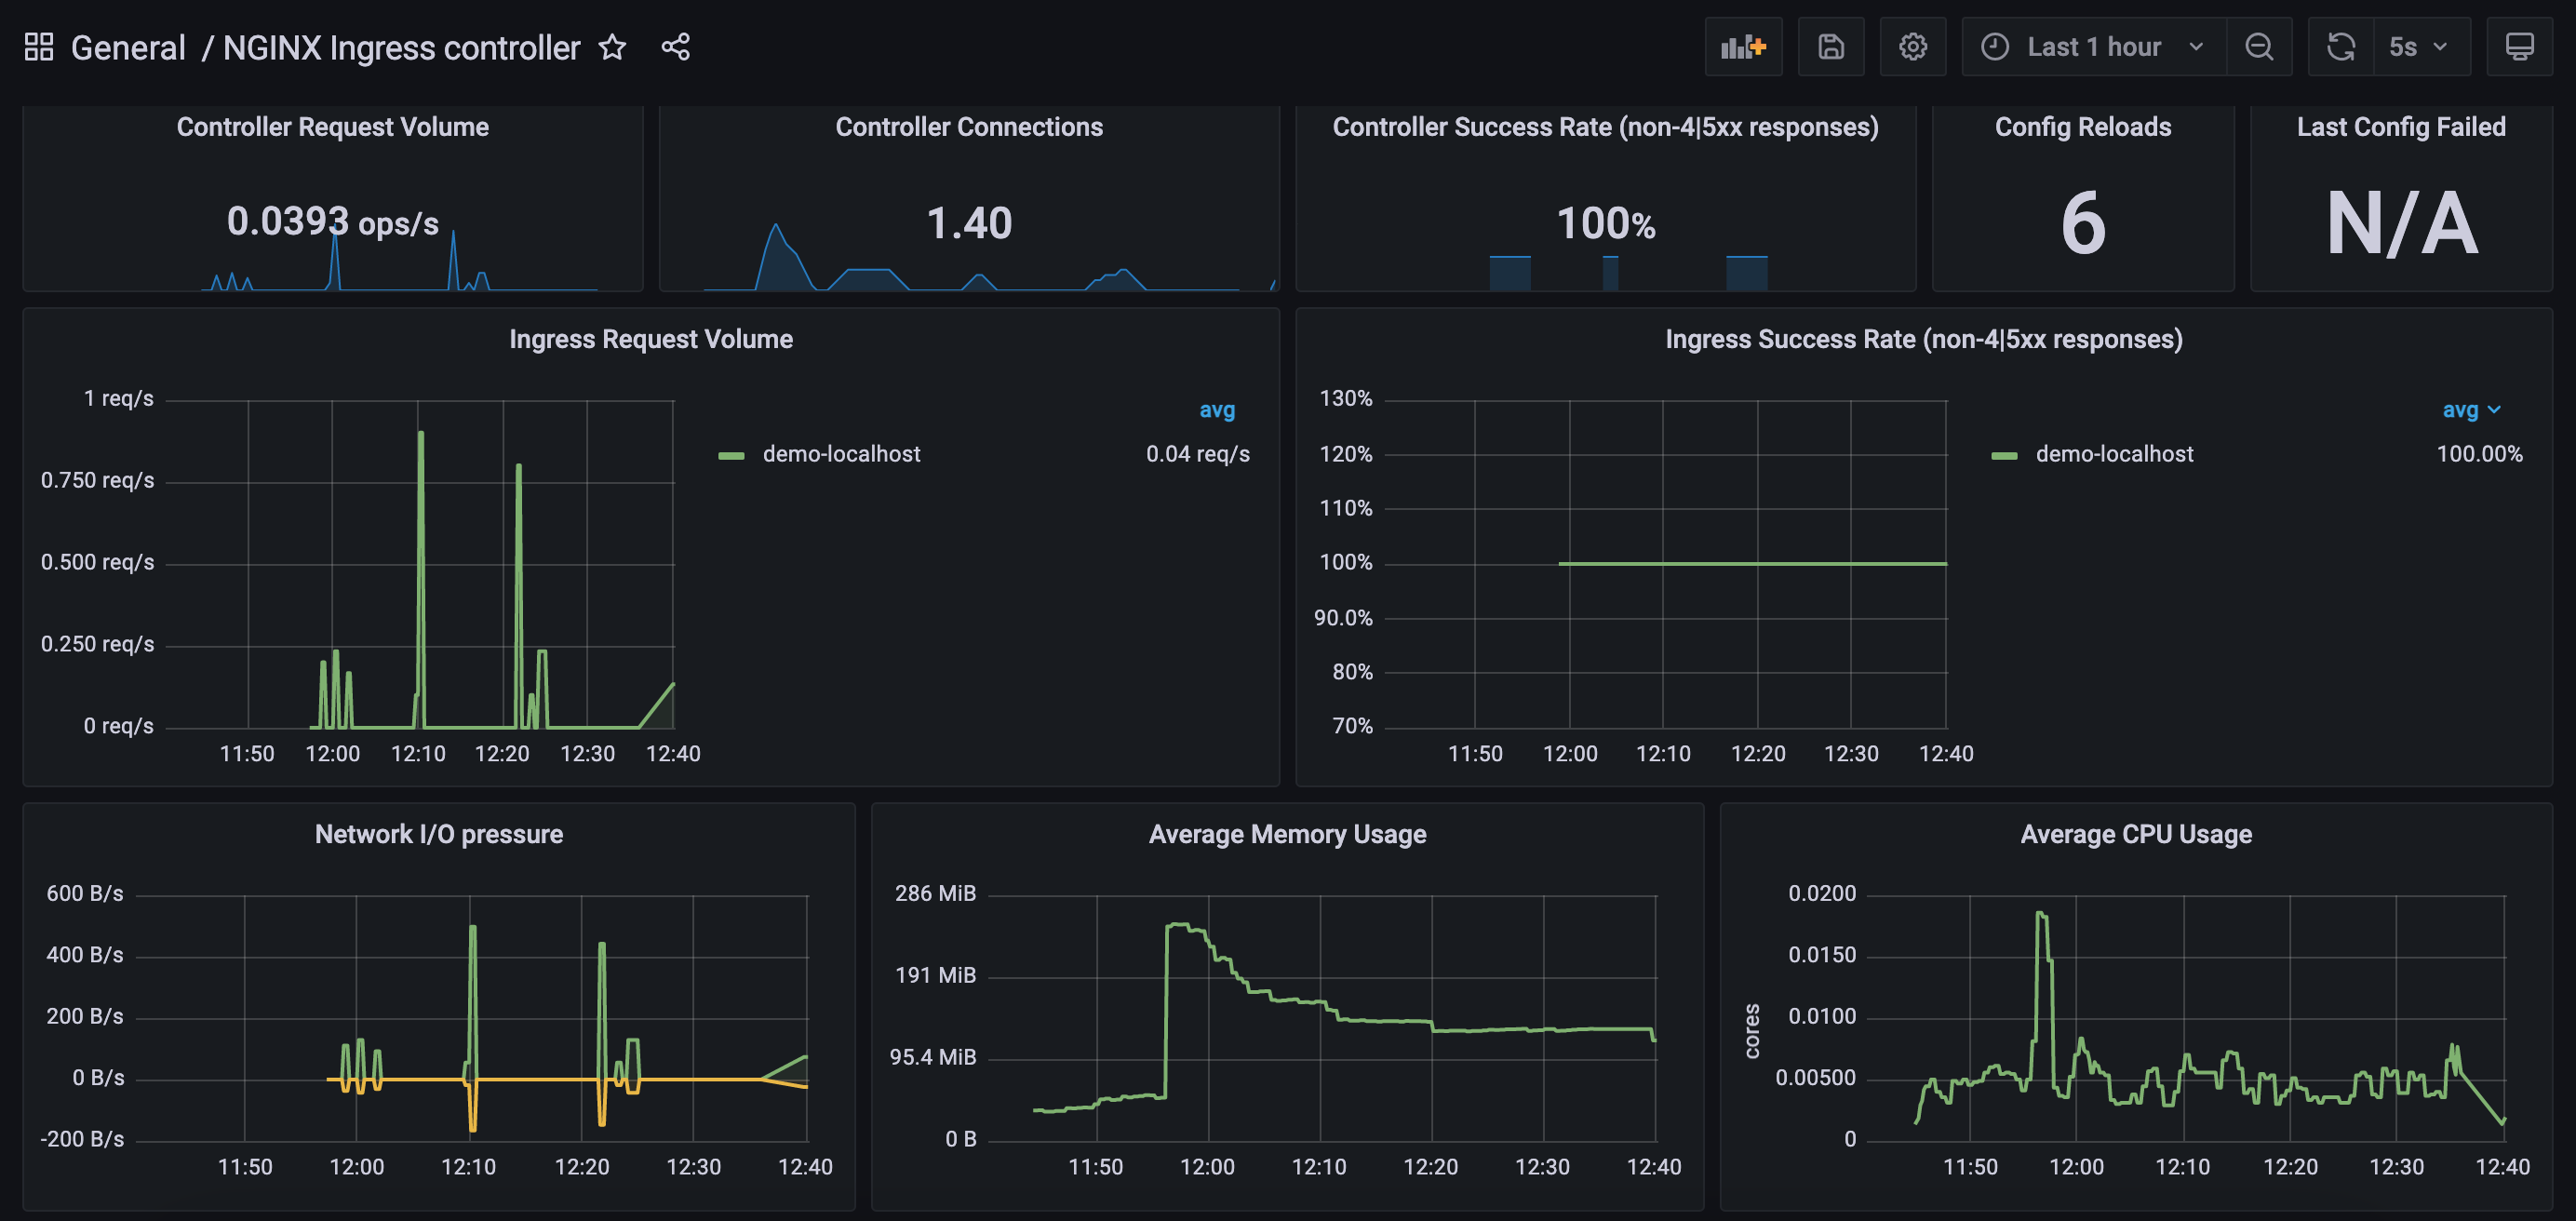
After the login you can import the Grafana dashboard from official dashboards, by following steps given below :
- Navigate to lefthand panel of grafana
- Hover on the gearwheel icon for Configuration and click "Data Sources"
- Click "Add data source"
- Select "Prometheus"
- Enter the details (note: I used http://CLUSTER_IP_PROMETHEUS_SVC:9090)
- Left menu (hover over +) -> Dashboard
- Click "Import"
- Enter the copy pasted json from https://raw.githubusercontent.com/kubernetes/ingress-nginx/main/deploy/grafana/dashboards/nginx.json
- Click Import JSON
- Select the Prometheus data source
- Click "Import"
Caveats
Wildcard ingresses
- By default request metrics are labeled with the hostname. When you have a wildcard domain ingress, then there will be no metrics for that ingress (to prevent the metrics from exploding in cardinality). To get metrics in this case you need to run the ingress controller with
--metrics-per-host=false(you will lose labeling by hostname, but still have labeling by ingress).
Grafana dashboard using ingress resource
- If you want to expose the dashboard for grafana using a ingress resource, then you can :
- change the service type of the prometheus-server service and the grafana service to "ClusterIP" like this :
kubectl -n ingress-nginx edit svc grafana- This will open the currently deployed service grafana in the default editor configured in your shell (vi/nvim/nano/other)
- scroll down to line 34 that looks like "type: NodePort"
- change it to look like "type: ClusterIP". Save and exit.
- create a ingress resource with backend as "grafana" and port as "3000"
- Similarly, you can edit the service "prometheus-server" and add a ingress resource.
PROMETHEUS AND GRAFANA INSTALLATION USING SERVICE MONITORS
This document assumes you're using helm and using the kube-prometheus-stack package to install Prometheus and Grafana.
Verify NGINX Ingress controller is installed
-
The NGINX Ingress controller should already be deployed according to the deployment instructions here.
-
To check if Ingress controller is deployed,
kubectl get pods -n ingress-nginx -
The result should look something like:
NAME                                        READY   STATUS    RESTARTS   AGE
ingress-nginx-controller-7c489dc7b7-ccrf6   1/1     Running   0          19h
Verify Prometheus is installed
-
To check if Prometheus is already deployed, run the following command:
helm ls -ANAME NAMESPACE REVISION UPDATED STATUS CHART APP VERSION ingress-nginx ingress-nginx 10 2022-01-20 18:08:55.267373 -0800 PST deployed ingress-nginx-4.0.16 1.1.1 prometheus prometheus 1 2022-01-20 16:07:25.086828 -0800 PST deployed kube-prometheus-stack-30.1.0 0.53.1 -
Notice that prometheus is installed in a differenet namespace than ingress-nginx
-
If prometheus is not installed, then you can install from here
Re-configure NGINX Ingress controller
-
The Ingress NGINX controller needs to be reconfigured for exporting metrics. This requires 3 additional configurations to the controller. These configurations are :
controller.metrics.enabled=true controller.metrics.serviceMonitor.enabled=true controller.metrics.serviceMonitor.additionalLabels.release="prometheus" -
The easiest way of doing this is to helm upgrade
helm upgrade ingress-nginx ingress-nginx/ingress-nginx \ --namespace ingress-nginx \ --set controller.metrics.enabled=true \ --set controller.metrics.serviceMonitor.enabled=true \ --set controller.metrics.serviceMonitor.additionalLabels.release="prometheus" -
Here
controller.metrics.serviceMonitor.additionalLabels.release="prometheus"should match the name of the helm release of thekube-prometheus-stack -
You can validate that the controller has been successfully reconfigured to export metrics by looking at the values of the installed release, like this:
helm get values ingress-nginx --namespace ingress-nginxcontroller: metrics: enabled: true serviceMonitor: additionalLabels: release: prometheus enabled: true
Configure Prometheus
- Since Prometheus is running in a different namespace and not in the ingress-nginx namespace, it would not be able to discover ServiceMonitors in other namespaces when installed. Reconfigure your kube-prometheus-stack Helm installation to set
serviceMonitorSelectorNilUsesHelmValuesflag to false. By default, Prometheus only discovers PodMonitors within its own namespace. This should be disabled by settingpodMonitorSelectorNilUsesHelmValuesto false - The configurations required are:
prometheus.prometheusSpec.podMonitorSelectorNilUsesHelmValues=false prometheus.prometheusSpec.serviceMonitorSelectorNilUsesHelmValues=false - The easiest way of doing this is to use
helm upgrade ...helm upgrade prometheus prometheus-community/kube-prometheus-stack \ --namespace prometheus \ --set prometheus.prometheusSpec.podMonitorSelectorNilUsesHelmValues=false \ --set prometheus.prometheusSpec.serviceMonitorSelectorNilUsesHelmValues=false - You can validate that Prometheus has been reconfigured by looking at the values of the installed release, like this:
helm get values prometheus --namespace prometheus - You should be able to see the values shown below:
prometheus:
  prometheusSpec:
    podMonitorSelectorNilUsesHelmValues: false
    serviceMonitorSelectorNilUsesHelmValues: false
Connect and view Prometheus dashboard
-
Port forward to Prometheus service. Find out the name of the prometheus service by using the following command:
kubectl get svc -n prometheusThe result of this command would look like:
NAME                                      TYPE        CLUSTER-IP       EXTERNAL-IP   PORT(S)                      AGE
alertmanager-operated                     ClusterIP   None             <none>        9093/TCP,9094/TCP,9094/UDP   7h46m
prometheus-grafana                        ClusterIP   10.106.28.162    <none>        80/TCP                       7h46m
prometheus-kube-prometheus-alertmanager   ClusterIP   10.108.125.245   <none>        9093/TCP                     7h46m
prometheus-kube-prometheus-operator       ClusterIP   10.110.220.1     <none>        443/TCP                      7h46m
prometheus-kube-prometheus-prometheus     ClusterIP   10.102.72.134    <none>        9090/TCP                     7h46m
prometheus-kube-state-metrics             ClusterIP   10.104.231.181   <none>        8080/TCP                     7h46m
prometheus-operated                       ClusterIP   None             <none>        9090/TCP                     7h46m
prometheus-prometheus-node-exporter       ClusterIP   10.96.247.128    <none>        9100/TCP                     7h46m
prometheus-kube-prometheus-prometheus is the service we want to port forward to. We can do so using the following command:
kubectl port-forward svc/prometheus-kube-prometheus-prometheus -n prometheus 9090:9090When you run the above command, you should see something like:
Forwarding from 127.0.0.1:9090 -> 9090 Forwarding from [::1]:9090 -> 9090 -
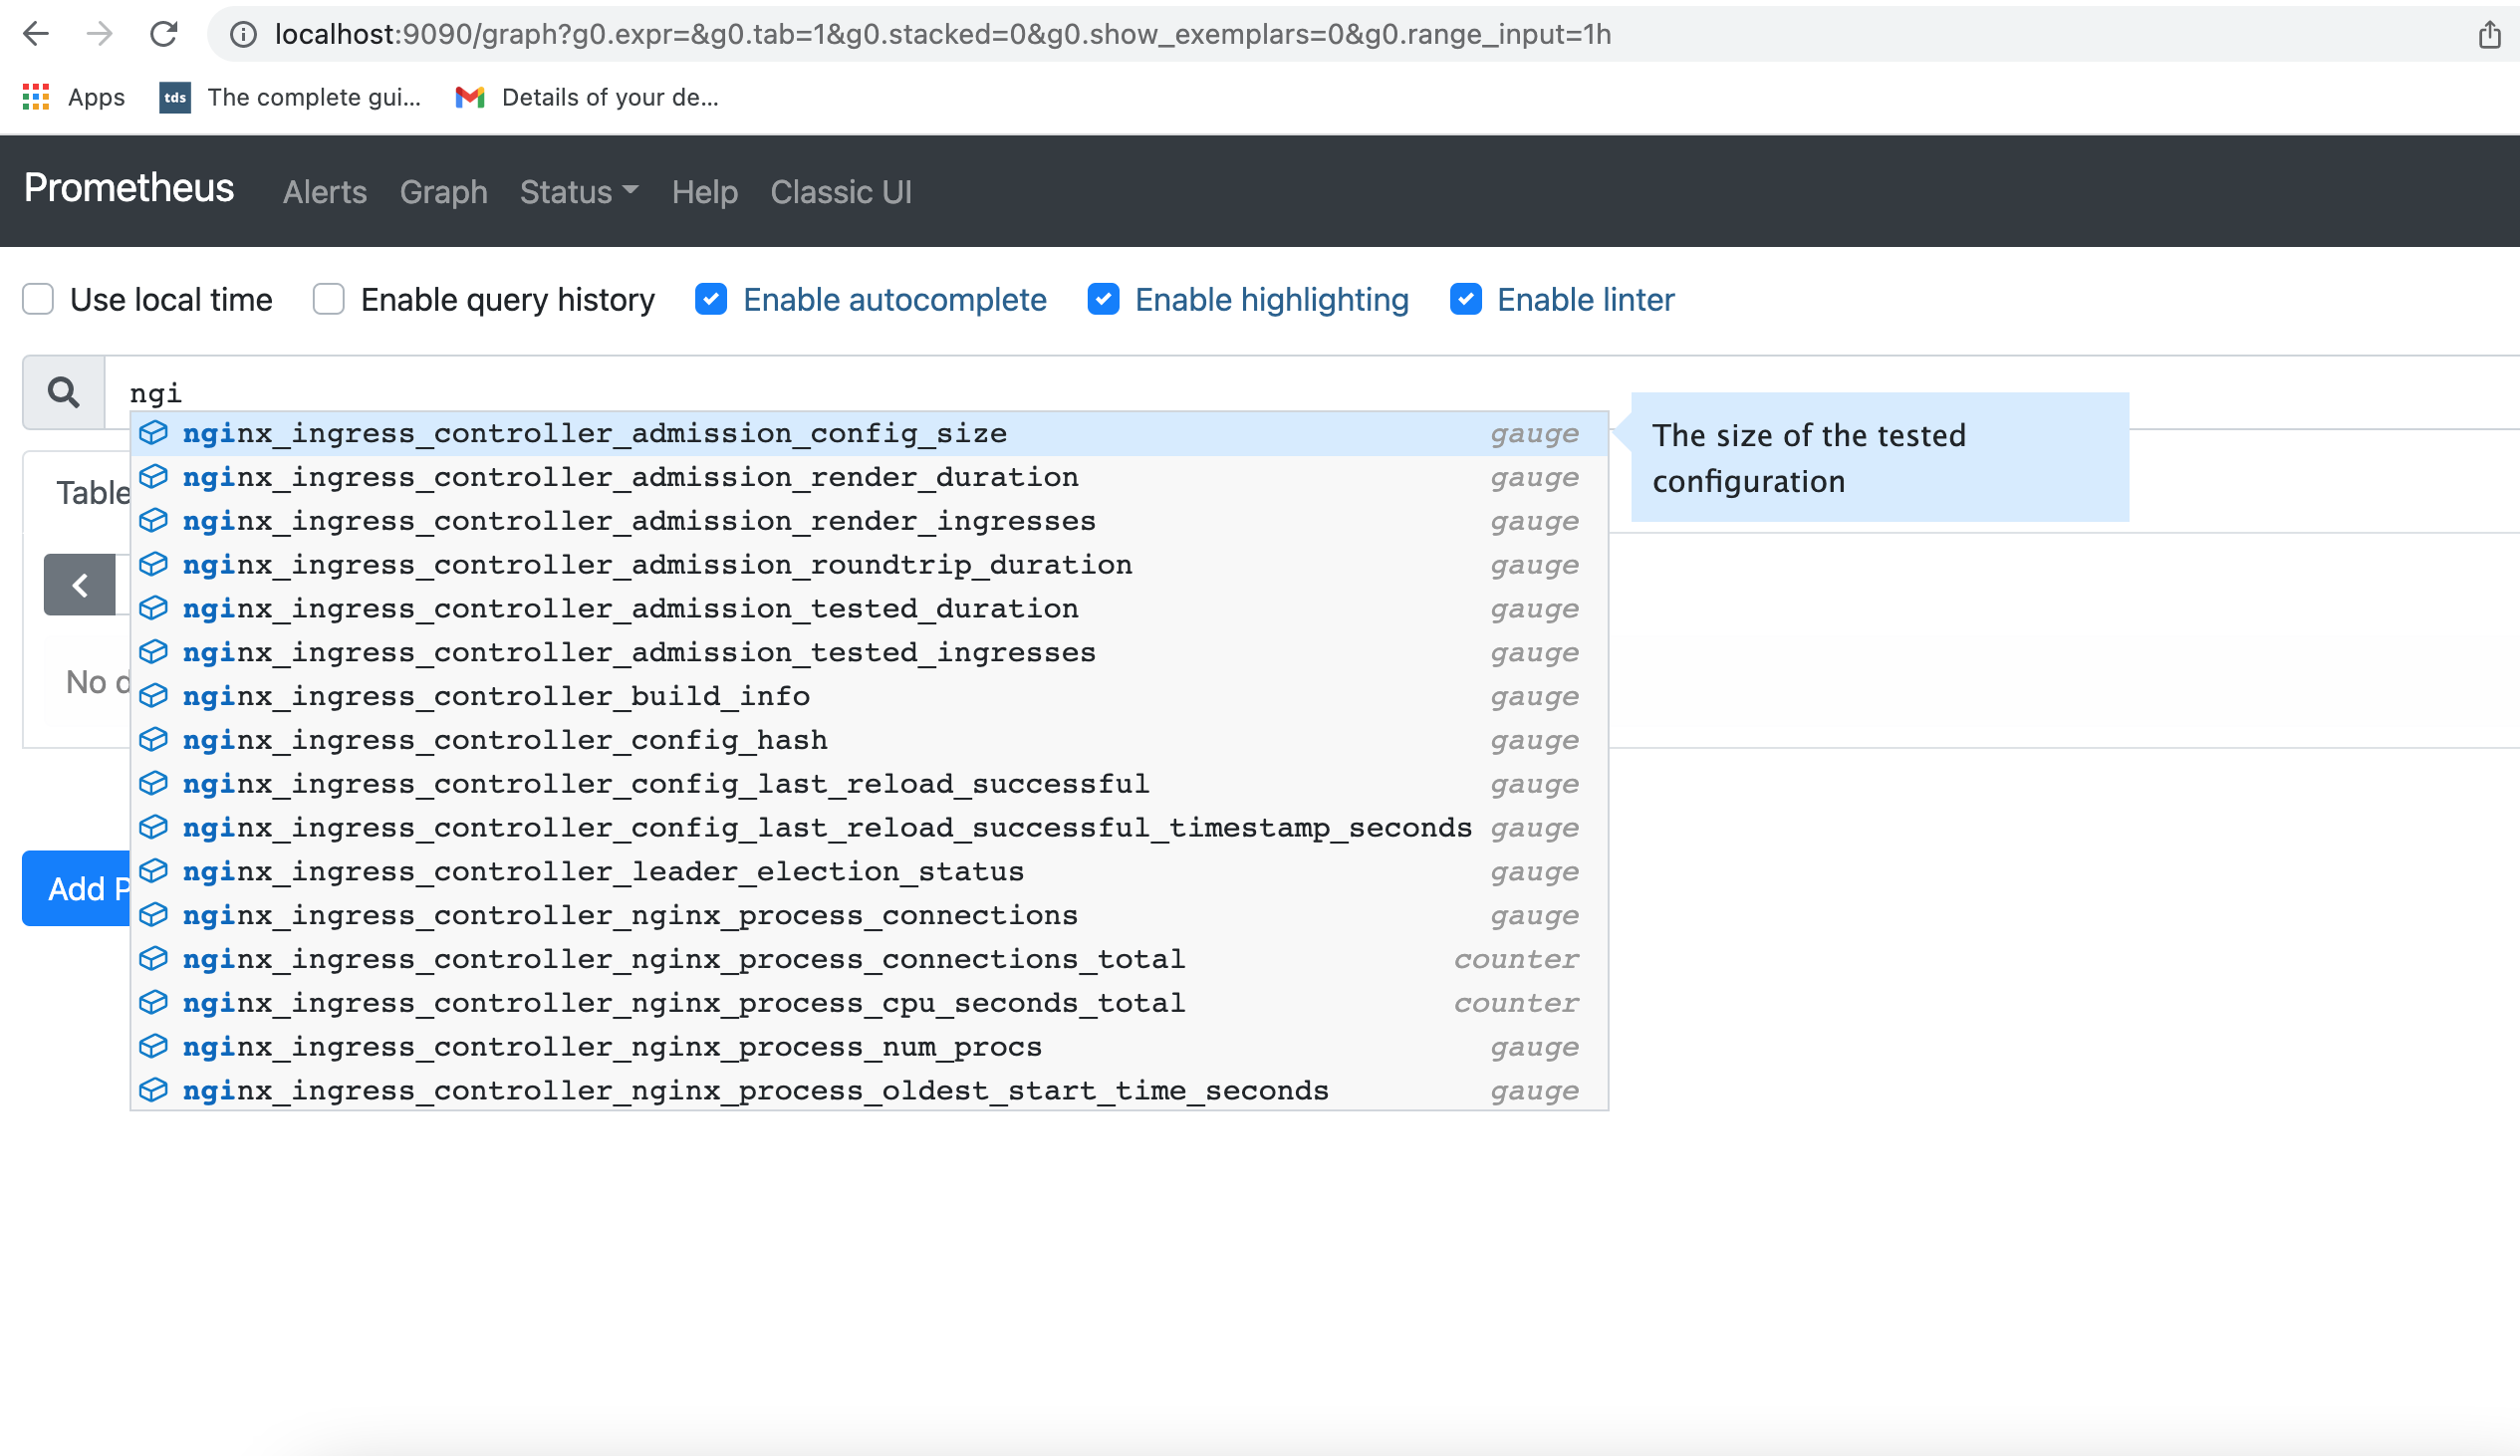
Open your browser and visit the following URL http://localhost:{port-forwarded-port} according to the above example it would be, http://localhost:9090
Connect and view Grafana dashboard
-
Port forward to Grafana service. Find out the name of the Grafana service by using the following command:
kubectl get svc -n prometheusThe result of this command would look like:
NAME                                      TYPE        CLUSTER-IP       EXTERNAL-IP   PORT(S)                      AGE
alertmanager-operated                     ClusterIP   None             <none>        9093/TCP,9094/TCP,9094/UDP   7h46m
prometheus-grafana                        ClusterIP   10.106.28.162    <none>        80/TCP                       7h46m
prometheus-kube-prometheus-alertmanager   ClusterIP   10.108.125.245   <none>        9093/TCP                     7h46m
prometheus-kube-prometheus-operator       ClusterIP   10.110.220.1     <none>        443/TCP                      7h46m
prometheus-kube-prometheus-prometheus     ClusterIP   10.102.72.134    <none>        9090/TCP                     7h46m
prometheus-kube-state-metrics             ClusterIP   10.104.231.181   <none>        8080/TCP                     7h46m
prometheus-operated                       ClusterIP   None             <none>        9090/TCP                     7h46m
prometheus-prometheus-node-exporter       ClusterIP   10.96.247.128    <none>        9100/TCP                     7h46m
prometheus-grafana is the service we want to port forward to. We can do so using the following command:
kubectl port-forward svc/prometheus-grafana 3000:80 -n prometheusWhen you run the above command, you should see something like:
Forwarding from 127.0.0.1:3000 -> 3000 Forwarding from [::1]:3000 -> 3000 -
Open your browser and visit the following URL http://localhost:{port-forwarded-port} according to the above example it would be, http://localhost:3000 The default username/ password is admin/prom-operator
-
After the login you can import the Grafana dashboard from official dashboards, by following steps given below :
- Navigate to lefthand panel of grafana
- Hover on the gearwheel icon for Configuration and click "Data Sources"
- Click "Add data source"
- Select "Prometheus"
- Enter the details (note: I used http://10.102.72.134:9090 which is the CLUSTER-IP for Prometheus service)
- Left menu (hover over +) -> Dashboard
- Click "Import"
- Enter the copy pasted json from https://raw.githubusercontent.com/kubernetes/ingress-nginx/main/deploy/grafana/dashboards/nginx.json
- Click Import JSON
- Select the Prometheus data source
- Click "Import"